Written by: Jackson Udy, PE
Process Engineer at Process Engineering Associates
October 24, 2020
Due to the current economic climate, many refineries and petrochemical plants are running at reduced capacities. Operating companies are more closely scrutinizing operating expenses in this low margin environment. As a process engineer or operations professional, we have the opportunity to find ways to reduce operating expenses by reducing energy consumption.
One of the areas inside process plants that takes up significant energy is distillation and fractionation. Distillation consumes over 40% of the total energy in the refining and chemical industry(1). In fact, distillation is 6% of the total energy usage in the United States. This is an incredible amount of energy! Thus process engineers should be consistently asking, am I minimizing energy usage in my distillation columns?
Two ways to reduce distillation energy usage are eliminate excess reflux and reduce tower pressure.
Is Your Distillation Column Over-refluxed?
Is your distillation column over-refluxed? To answer this question, determine the specifications required for each stream exiting a column. For example, a depropanizer column in a refinery may require a 95% propane product purity and at least 95% butane concentration in the bottoms stream. Suppose the column is operating at 99% propane purity while meeting bottoms specifications. How much energy is being wasted in this scenario?
The figure below shows the difference in duty for the two cases described above. The 99% purity case consumes 33% more energy than the 95% purity case. For the 10,000 BPD example below, this translates to a savings of 5 MMBTU/HR. If energy in this scenario costs $3/MMBTU, this would come out to $130K per year in energy savings.
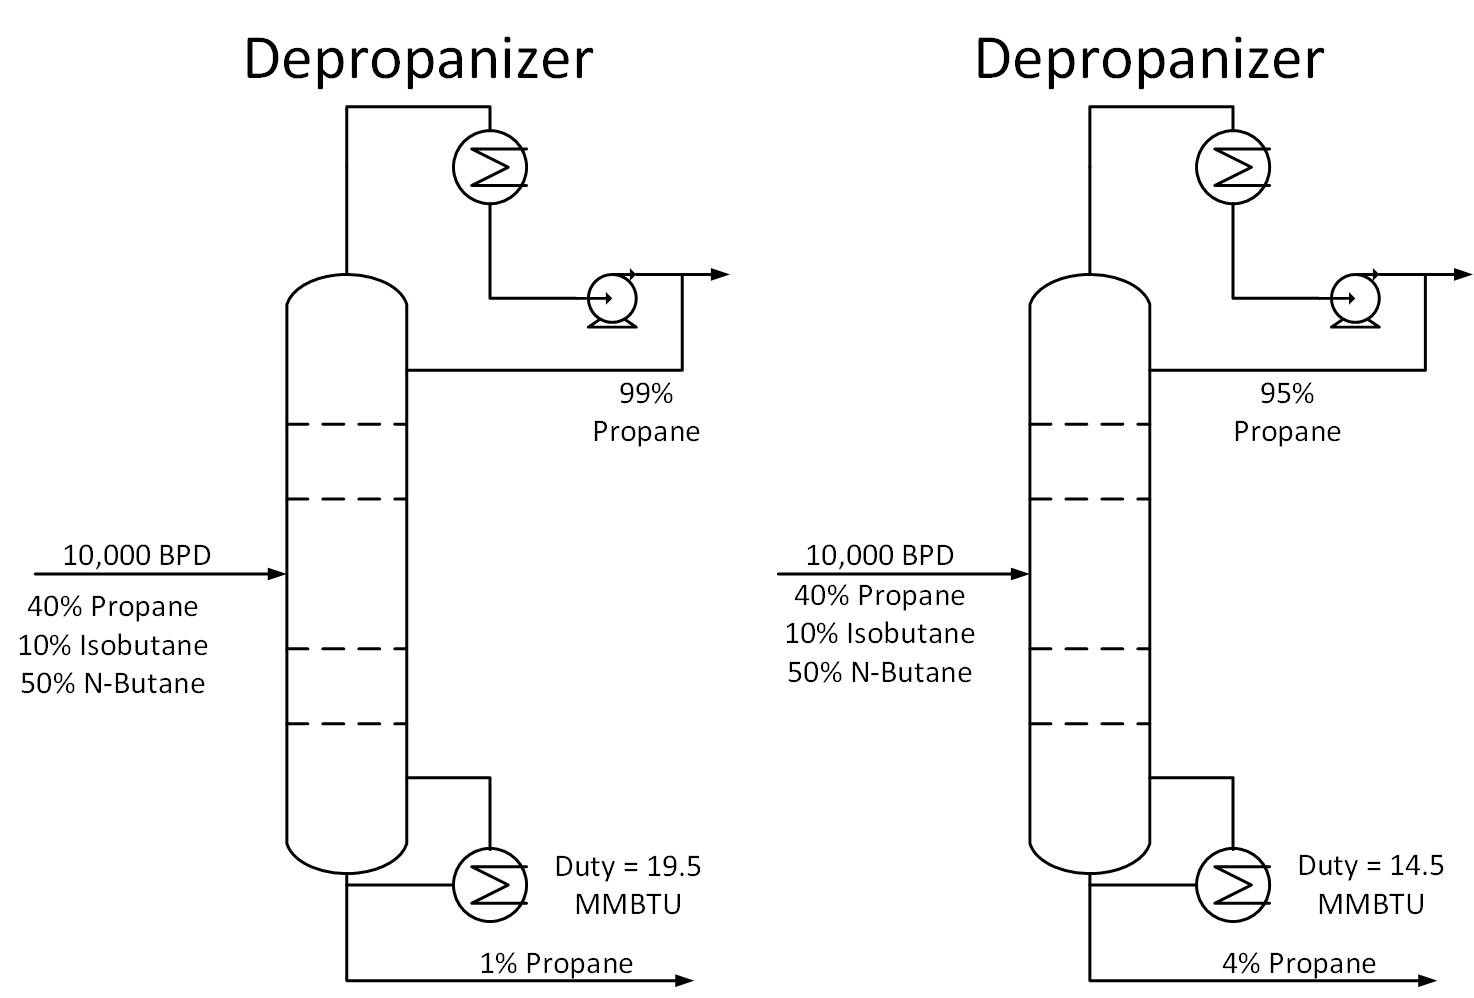 Typically operators will target above the required product purity to absorb any swings in tower operation while keeping product streams on spec. Reducing this ‘overshoot’ as much as feasible can result in great energy savings.
Over refluxing towers wastes a significant amount of energy, and sometimes with little or unnecessary improvement in product purity or yields.
Reducing Energy Usage by Decreasing Operating Pressure
Another way to reduce energy usage is by reducing tower pressure. This can be especially effective in the winter months, when cooling water and ambient temperatures are lower, increasing the available process cooling. Reducing tower pressure reduces energy consumption because the relative volatility of hydrocarbons increases at lower temperatures. This makes them easier to separate, i.e. requiring less energy. This is especially true of lighter hydrocarbons (C1-C6).
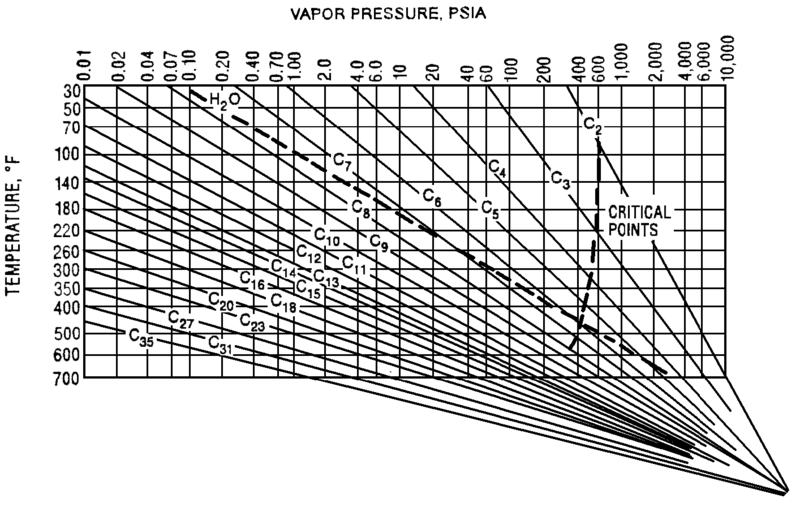 The Cox Diagram(3) above shows why decreasing column pressure reduces energy consumption. For any given compound, as column pressure decreases, the flash temperature also decreases. The diagram above shows the relationship between flash temperature and vapor pressure. As flash temperature decreases, so does the vapor pressure for each hydrocarbon. But more importantly, the difference in vapor pressure between the compounds increases. For example at 180 deg F, The relative volatility between propane and butane is
Relative Volatility @ 180 F= VP C3/ VP C4
= 400 psig/150 psig
= 2.7
Suppose the overhead pressure in a column is lowered until the overhead temperature reaches 100 deg F.
Relative Volatility @ 100 F= VP C3/ VP C4
= 200 psig/ 50 psig
= 4.0
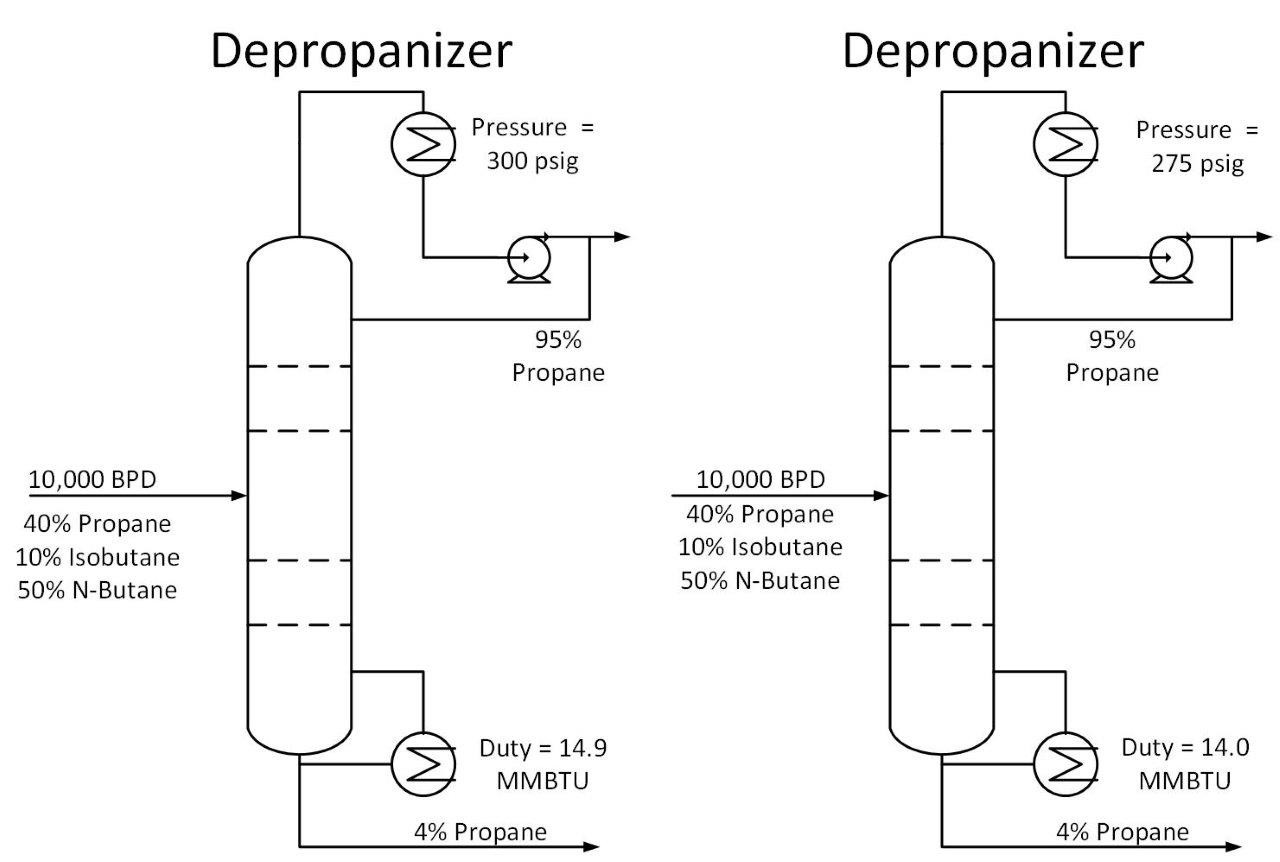
As shown above, decreasing operating pressure will increase relative volatility. This in turn reduces the required energy to perform a given separation. Let’s return to our depropanizer example. Suppose we drop the operating pressure in this tower from 300 psig to 275 psig. This reduces the required energy in our tower by 7%, saving $25k/year in our example.
 One thing to consider when reducing tower pressure is that the reduction in tower pressure will cause an increase in vapor velocity inside the tower. This increases the chance of flooding inside the tower.
Savings energy is not only good for the bottom line, it is also good for the environment, conserving natural resources. If you find this article useful, let me know in the comments below. What ways have you reduced energy usage in distillation columns?
References
1) https://www.emersonautomationexperts.com/2010/industry/downstream-hydrocarbons/reducing_distil/#:~:text=Did%20you%20know%20that%20there,energy%20consumed%20by%20U.S.%20manufacturers.
2) Lieberman, Norman and Elizabeth Lieberman. A Working Guide to Process Equipment. McGraw-Hill Education, 2014.
3) https://petrowiki.org/Vapor_pressure