
Designing critical OSBL facilities for the Sadara Project presented the UPI team with some unique challenges, which required innovative solutions.
Written by Mr. Joe Matherne, Chief Process Engineer, Process Engineering Associates, LLC
December 7, 2020
The Sadara Chemical Company is a joint venture between The Dow Chemical Company and Saudi Aramco. Sadara constructed at Al Jubail, KSA the world’s largest petrochemical complex ever executed in a single phase. Total CAPEX for the Sadara project was approximately $20 billion. Its 6-km2 site features 26 integrated, world-scale manufacturing plants that produce a total of over 3 million metric tons of high value-added plastics and chemical products each year. (1)
The Sadara site includes a world-scale Mixed Feed Cracker (2), which went live in 2016 (7), and produces approximately 1.5 million tons per year of ethylene and approximately 400,000 tons per year of propylene (5, 8).
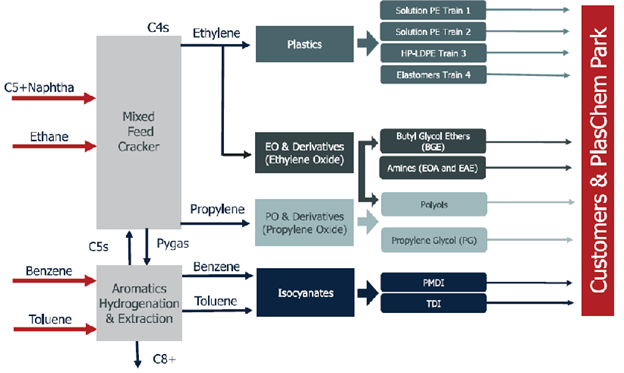
Figure 1- Sadara Configuration (2)
The design teams for the 26 process plants were located in contractor offices all over the world during the FEED and detailed design phases of the project (5, 8). The scope of the Sadara Utilities, Power, and Infrastructure (UPI) Project (3), which was developed in the US and UK, included:
- Steam Generation and Utilities
- Power Distribution
- Interconnecting Facilities
- Waste Treatment
- Interface Management
The Sadara Steam Generation plant featured six 80MW boilers, each fitted with advanced NOx and SOx emission control systems (6). The UPI Interconnecting Facilities scope included distribution of 6,000m3/hour of desalinated water produced by a third party for makeup to cooling towers located throughout the site (4). The Waste Treatment scope included two world-scale Thermal Treatment Units to process hazardous, toxic, and halogenated hydrocarbon wastes generated across the complex (7).
Designing critical OSBL facilities such as these supporting a megaproject like Sadara presented the UPI team with some unique challenges, which required innovative solutions.
Practically all of the UPI project facilities had to be mechanically complete and commissioned before any of the process plants could begin to start up. Yet the schedule for the Sadara project required the UPI team to finalize the design of their facilities before the design for many of the process plants had advanced far enough to allow their utility and waste treatment requirements to be firmly set. To overcome this schedule disconnect, as the UPI team collected utility and waste treatment demand data from the teams designing the individual process plants, they were asked to not only define the expected normal and peak stream flowrates, they were also asked to honestly assess how firm that data was. Based on this information, the UPI team assigned an “uncertainty factor” to each bit of design data, which reflected the extent to which the utility and waste treatment demands reported by the process plant design teams could grow as their designs progressed. Essentially a design margin, an uncertainty factor of 1.0 was assigned to data UPI received regarding any process plant whose design was finalized and thus considered firm. A higher uncertainty factor, up to 1.5, was assigned to design data UPI received regarding any process plant whose design was preliminary, and hence potentially subject to significant growth. Although subjective and imprecise, this approach nonetheless allowed the UPI team to assemble the design data for their facilities in a manner consistent with the overall Sadara project schedule.
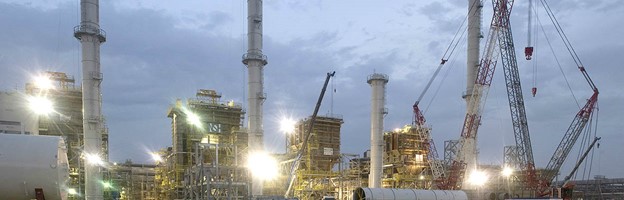
Figure 2 – Sadara Steam Boilers Under Construction (3)
The UPI team next had to aggregate the individual bits of uncertainty-adjusted utility and waste treatment demand data regarding the 26 individual process plants into design requirements for the overall Sadara site utility and waste treatment systems. UPI was charged with designing cost-efficient facilities that would support up to the peak flowrate for each utility stream going to or waste stream coming from each of the process plants, whether during startup, shutdown, or any other non-steady-state operating condition. And yet it would have been uneconomical for UPI to design their facilities to accommodate all the peak flowrates for any given utility supply or waste treatment system from all relevant plants occurring simultaneously. Thus, for the first pass, the UPI team adopted the philosophy of designing each utility and waste treatment system for the “sum of the normals plus the greatest single peak.” In other words, UPI started with the assumption that all peak utility demand or waste generation scenarios for the various process plants would occur independent of each other. Then UPI went back and, in collaboration with the design teams for the process plants, identified scenarios in which one or more of the utility or waste generation peak flows could occur simultaneously, and only designed for such scenarios by exception. Thus, the Sadara UPI team met its obligation to design cost-efficient facilities that would support the full range of expected operations for the process plants.
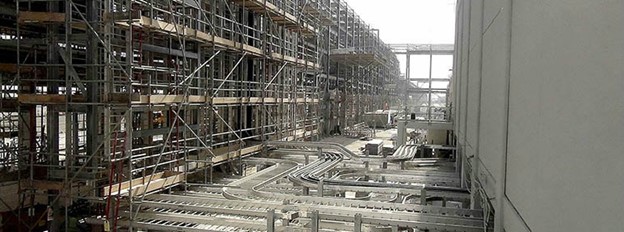
Figure 3 – Sadara Power and Piperack Interface (3)
Due to its massive scale, UPI’s interface management role presented the team another unique challenge. There were several hundred interface points between UPI’s facilities and those of the 26 individual process plants to be tracked and managed as the Sadara project progressed. These interface points included not just utility and waste streams, but also all raw material feedstocks and any process streams exchanged among the process plants that passed through UPI’s Interconnecting Facilities. At first, the only information that was known regarding each of these interface points was what might be found in a typical process simulator – normal and peak flowrate, composition, temperature, pressure. Then, as the design progressed, the interface data was expanded to include pipe size and flange rating, which had to match between the UPI and ISBL sides of each interface point. During detailed design, the interface data was further expanded to include the physical location in space for each interface point, which again had to match exactly – to the millimeter. During construction, the interface data was finalized by including the date when the section of pipe making up each half of each interface point was expected to be installed. None of the Sadara interface management work was azeotropic distillation. But just the sheer volume of data that had to be exchanged, checked, and repeatedly rechecked during each phase of the project with teams scattered all across the globe for the hundreds of individual points in UPI’s interface management database made this critical aspect of UPI’s scope a major undertaking.
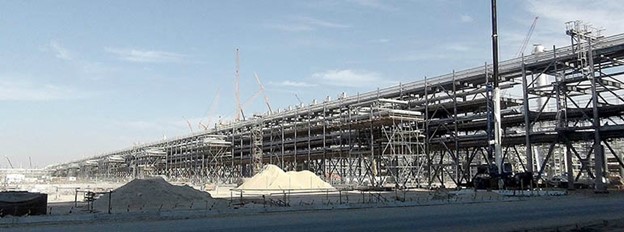
Figure 4 – Sadara 2km Interconnecting Facilities Piperack (3)
Hydraulic hammer, or surge, is typically only considered in process plants for long liquid lines. But since UPI’s Interconnecting Facilities spanned across Sadara’s entire 3km x 2km site, every liquid line was a long line. UPI conducted over a hundred hydraulic hammer calculations and ten dynamic simulations, and then managed the resolution of all problems that these evaluations uncovered. Vapor waste streams presented the UPI team a different challenge. UPI conducted heat-loss calculations on each of the vapor waste streams between the sending process plants and the UPI waste treatment systems, and identified the insulation and/or heat tracing needed to keep each stream safely above its dew point throughout.
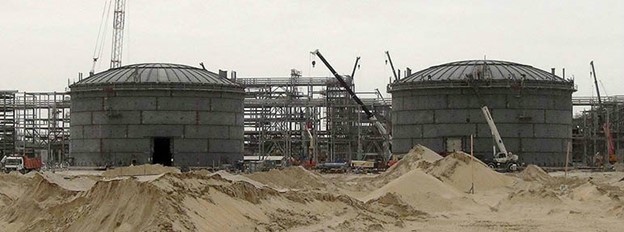
Figure 5 – Sadara 35m Wastewater Tank Construction (3)
In the end, the Sadara Project was a resounding success due in no small part to the contributions of the Utilities, Power, and Infrastructure Team that designed and installed critical OSBL facilities supporting the entire $20 billion venture. The Sadara UPI team learned along the way how to overcome the unique process risks associated with such a megaproject, stitching together Sadara’s 26 process plants so they could work together as parts of a unified whole.
References
- Sadara Corporate Brochure_EN.pdf
- Dow_Sadar_Update20Mar2014.pdf
- Sadara Integrated Chemicals Complex – Fluor.html
- Pentair – Case study about Sadara Codeline.html
- Dow and Saudi Aramco continue to award Sadara packages – 2B1stconsulting 2B1stconsulting.html
- Semi dry scrubber systems Hadek Sadara Steam Station.html
- Sustainability Report 2018 – Landscape.pdf
- Sadara Chemicals Complex, Al Sharqiya, Saudi Arabia – Chemical Technology.html